Solving Leakage Problems on Car Door Assemblies
Scanning and Inspection Pty turns to PolyWorks® and analyzes the relationship between the door frame and the car body in less than 1 hour.
Manufacturers know when something goes wrong but finding out why is often a much more involved process. The ensuing course of investigation consumes time, money, and resources. Even once the problem has finally been identified, making quantified adjustments is yet another stage en route to rectification. Sometimes the manufactured part is different from the designed part, or different to how it should be or has been in the past, but by how much, where, and in which direction? For a major Australian car manufacturer, identifying the cause of leakage on door assemblies was a priority.
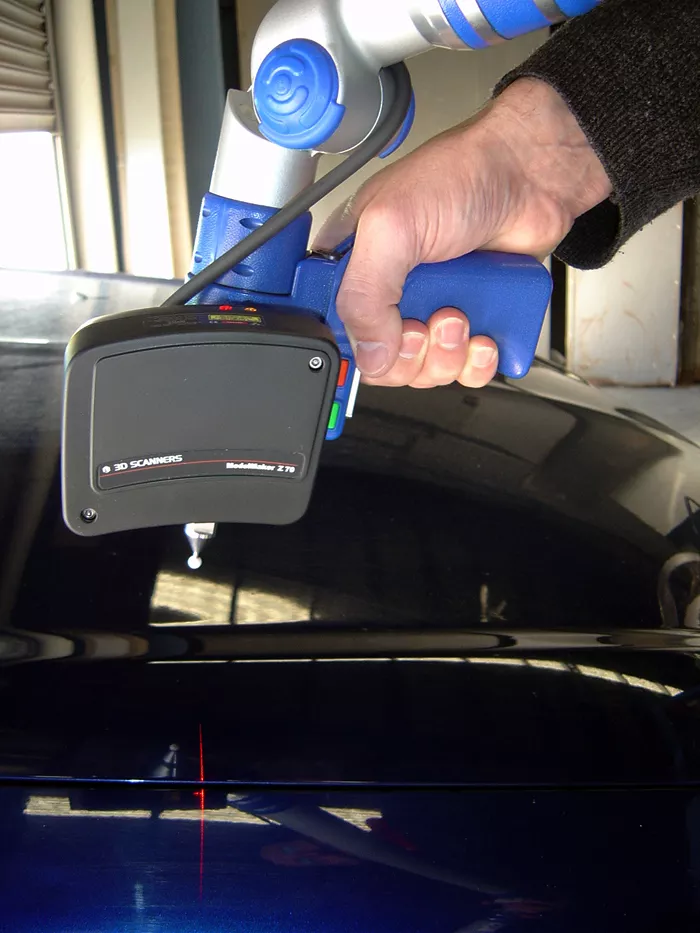
ModelMaker Z70 mounted on a FaroArm
The Challenge
An automobile manufacturer recently experienced one of those unavoidable manufacturing scenarios. They encountered variations in the alignment of certain passenger cabin door seals that they produced and assembled. It was apparent that certain cars that had been manufactured during one specific facet of the car production were as expected, the doors and seals all lined up with the rest of the car body seamlessly. However, those coming off the production line at a later stage were experiencing water leaks during the testing stage. The first task concerned locating where the water was getting through, but the more involved analysis was with regards to the relationship between the door frame and the car body. Yet figuring out what was different to that of the vehicles that were not leaking, and determining by how much, where, and in which direction posed a set of challenges.
If one batch of the automotive assemblies came out of production and experienced no leakage problems and others produced at a later stage were leaking, then they must somehow differ in their structure. How does the problematic door frame assembly differ from its ‘good car’ counterpart? In order to learn what changes need to be made during production, the customer needs to be able to quantify the discrepancy. The relationship and the variations between the ‘good’ and ‘bad’ door frame assemblies need to be evaluated. A detailed comparative analysis was acquired, and thanks to the latest in laser scanning technology and the PolyWorks® software suite, it was achieved within hours.
The Solution
Data acquisition
To quickly and efficiently capture the surface information, specialists at Scanning and Inspection used a laser scanner mounted on an articulated arm. The type of laser scanner utilized for this application was the ModelMaker Z70, a high-quality scanner capable of digitizing a surface at a remarkable density of 0.05 mm x 0.05 mm, which is around 400 points per square millimeter. This results in a realistic, full, 3D digital representation of the part, a plethora of data just waiting to be transformed into useful information. The scanner gets its 3D reference from a portable CMM, in this instance a Platinum FaroArm, which measures to a repeatability ranging from ±0.051 mm depending on its size. The FaroArm and MMZ70 Laser Scanner were wheeled into position onsite thanks to a heavy-duty tripod, hence the hardware could be conveniently set up adjacent to the car doors in question. Capturing the required surface data took only a few minutes per car.
The PolyWorks Process
Once the scan data was collected, the post-processing stage of the analysis began. Using PolyWorks, specialists at Scanning and Inspection Pty Ltd. virtually aligned the laser scanned data from the “leaking” car to the one of the “good” car, and performed advanced measurement and comparison analyses. However, prior to performing the comparative analyses, a series of point cloud manipulations had to be conducted in PolyWorks.

Data acquisition
Refining the scan alignment
During the data acquisition stage of the job, several scan passes were obtained. Each scan patch is automatically aligned using the articulated arm’s native alignment technology that provides the spatial reference for the changing location of the laser scanner. Most of the point clouds acquired by the laser scanner “sit” on top of others that have already been accounted for by other passes of the scanner. Certain portions of the part are consequently measured more than once. These areas of multi-tiered data are referred to as areas of overlap.
To refine the aligned point cloud obtained from the portable CMM, the PolyWorks IMAlign module uses these areas of overlaps to realign all scans. First, a deviation analysis was performed on the aligned point cloud. PolyWorks automatically computes the average distances between each overlapping scan and displays a color that represents a deviation value. In a glance, users can identify the scans that are out of tolerance and that can be improved through realignment.
Then, using the PolyWorks “best-fit” alignment technology, a re-alignment was performed. To prevent “sliding” between patches in the same neighborhood, eight control points are automatically set for each scan, which constrain the degrees of freedom. This feature differentiates PolyWorks from other scan alignment solutions, which often encounter sliding problems during scan alignment. After the constrained best-fit alignment is performed, a new deviation analysis is computed and a color map is displayed.
The last step consists in creating a single-layered point cloud model by intelligently averaging all over-lapping scans using the PolyWorks “reduce overlap” technology. The resulting point cloud can now be transformed into a surface that will be used for further analysis such as door-to-door comparisons. The scanning methodology was the same for both the ‘leaking’ and the ‘good’ cars. All peripheral trim was removed from the window frames and doorframes to expose only the post-production structural steel components. The doors were closed throughout the data capture process and the relevant areas associated with the leaking seals were scanned using the MMZ70 laser.
As the laser stripe is moved across the surface, collecting tens of thousands of 3D points per second, the subsequent surface immediately appeared on the computer screen. The capabilities of this real-time, point cloud surface display meant that areas that were missed, or still needed to be scanned, could be identified at the time of measurement and consequently accounted for.
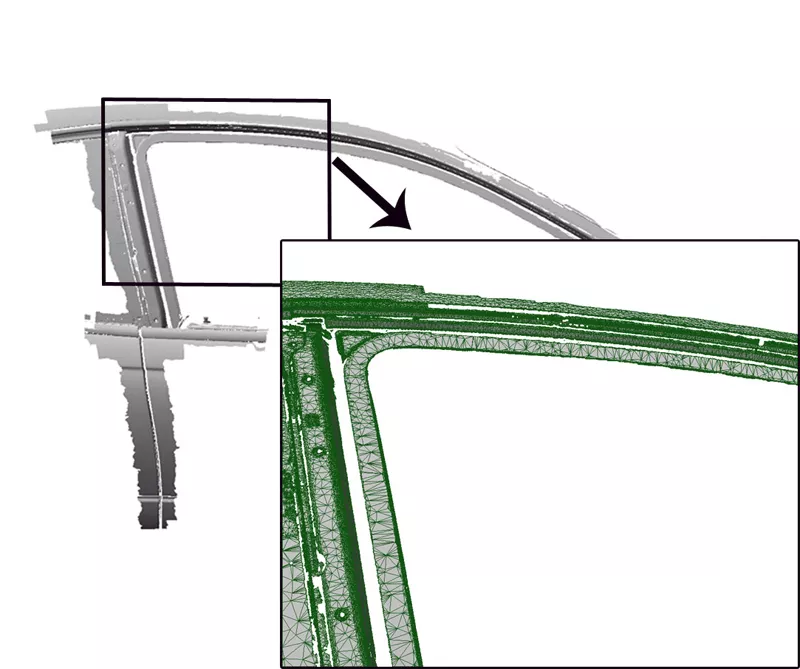
Creation of a polygonal model
Creating a polygonal model
In order to compare the surfaces of the “good” and “bad” doorframe assemblies, Scanning and Inspection needed to convert the point clouds to something it could use as a surface. PolyWorks converted the tens of millions of points from the point cloud into a triangulated mesh in the blink of an eye. The software used each of the points as nodes for the millions of tiny triangles it constructed.
To accurately describe the various shapes of the scanned object, PolyWorks uses fewer triangles for the more consistent sections of the car’s surface and more triangles when the contouring gets complex, all based on tolerance values specified by the user. Nearest neighbor and search distance parameters are also stipulated prior to the conversion and to create the triangulated surface and reduce the inherent digitizer noise to a minimum.
Door-to-door comparisons
Using a complex series of “least squares” mathematics and surface analysis, the two newly triangulated and optimized laser scan datasets were laid one atop the other and aligned using the PolyWorks best-fit alignment technology. PolyWorks then developed a color-coded distribution pattern highlighting the comparison of the two assemblies. The resulting color error map allows to easily distinguish patterns that identify how the “bad” car door that is experiencing the leakages relates to the “good” car door.
The B-pillar and lower sections of the doors display a light-green (near aqua) color that indicates a deviation below ±0.5 mm between the two sets of doors. Other regions, like the steel window frame that is welded to the door itself, are illustrated in green, which equals a deviation of ±1-2 mm. Finally, the orange section, located on the chassis of the car, also indicates a deviation of ±1-2 mm.
In other words, when the B-pillars of the two cars were aligned to within 0.5 mm, the window frames of the leaking car were actually positioned between 0.5 mm and 2 mm below that of the vehicle that was not susceptible to leakage, a spacing certainly great enough for water to pass through.
The Benefits
The engineers from Scanning and Inspection actually found that it would be much easier to change the welds responsible for the position of the doorframe than to adjust the chassis in any way. The welding where the window frame meets the door was adjusted so that the frame didn't sit so low (compared to the door that didn't leak).
The entire PolyWorks inspection process was performed in less than 1 hour.
The conclusions drawn from the investigation mainly concentrated the concerns of the customer to the vehicle’s window frame, or more specifically the way it was being welded to the main door assembly. Suitable adjustments were conducted in relation to the welding treatments to ensure that the window frame was no longer situated too far inside its ideal position, as outlined in the initial CAD design.
The accuracy and flexibility of the FaroArm and the MMZ70 laser scanner, used in combination with the world-class PolyWorks software, enabled this car manufacturer to:
- Quickly identify the source of the leakage problem
- Accurately measure the physical deviation of “bad” car door assemblies compared to the “good” ones (by how much, where, and in which direction)
- Modify the assembly process by adjusting the welding where the window frame meets the door
- Perform the entire inspection process in less than 1 hour